Public finance · FY2016–FY2025
Texas local debt is up 75% in nine years
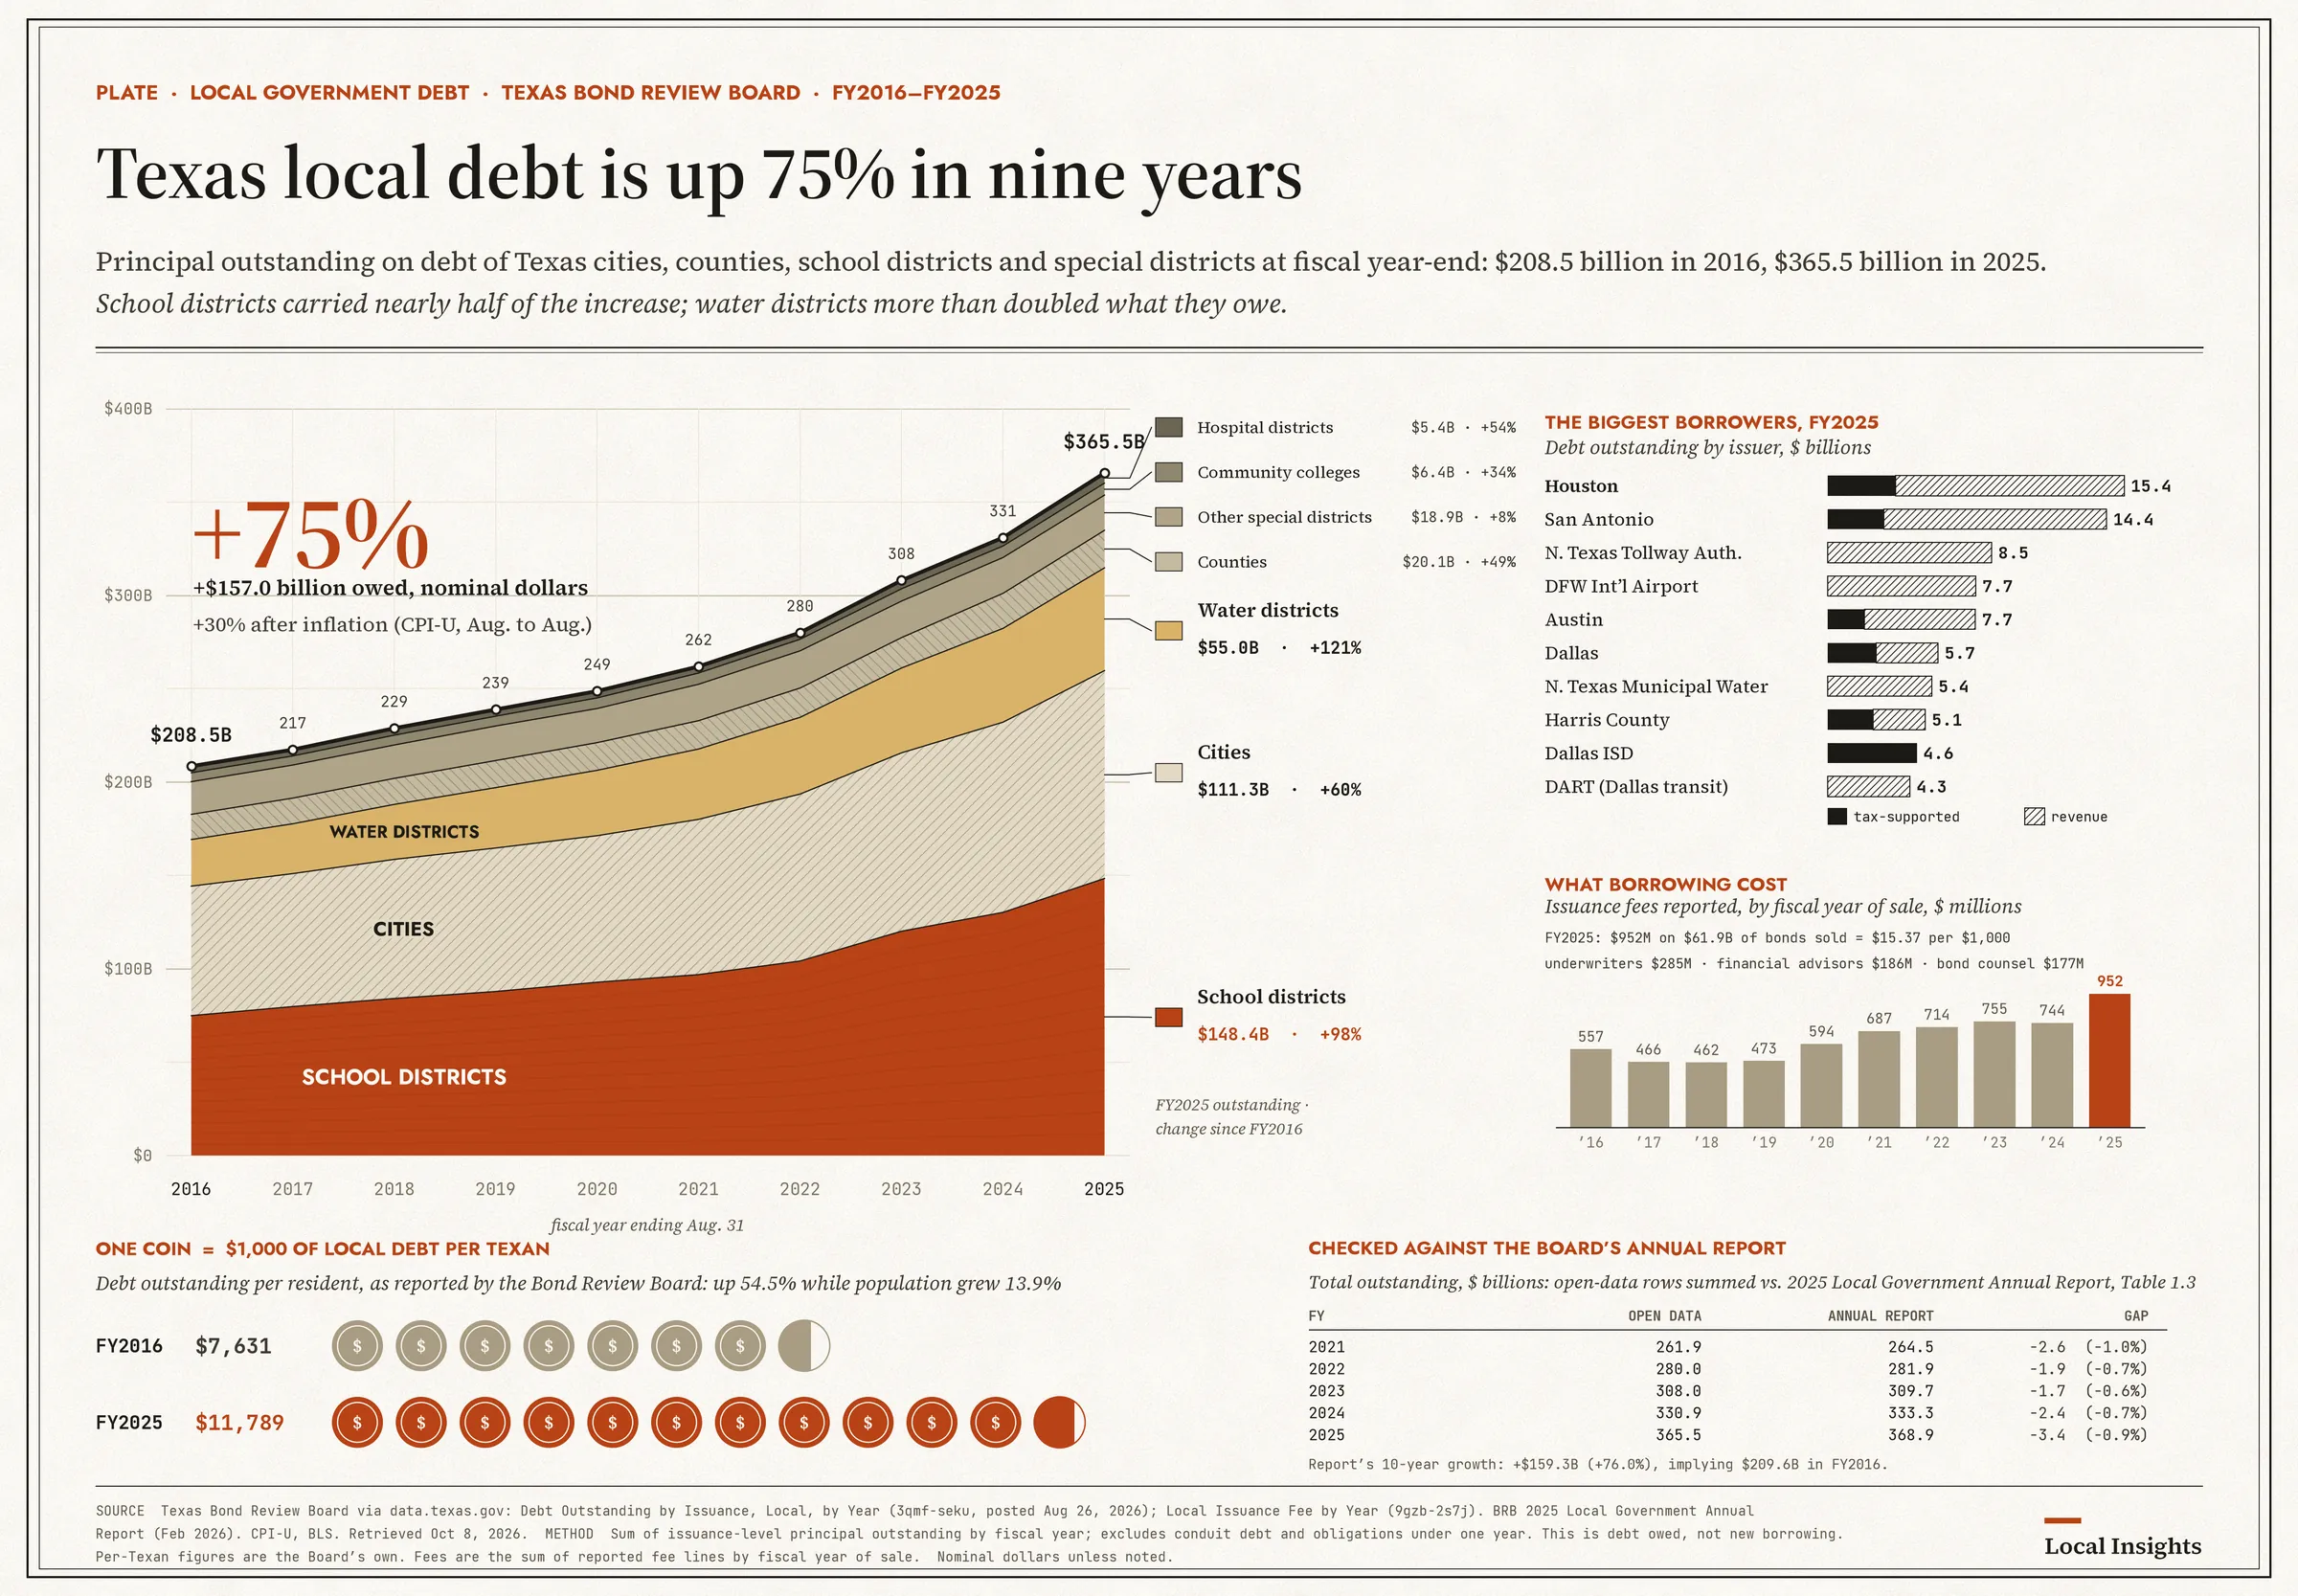
Local governments owed $365.5 billion at the end of fiscal 2025, up from $208.5 billion in fiscal 2016. That is debt still outstanding, not new borrowing. The Bond Review Board’s annual report puts the 2025 total at $368.9 billion.
Sum of open-data rows in the Bond Review Board’s debt-outstanding file, checked against the 2025 Local Government Annual Report. Retrieved October 8, 2026.
What grew
Summing the open-data rows for principal still owed, local debt outstanding rose from $208.5 billion in FY2016 to $365.5 billion in FY2025, an increase of $157.0 billion, or 75.3 percent. After inflation, using U.S. CPI-U from August 2016 to August 2025, the real increase is 30.3 percent.
School districts account for 46.8 percent of the dollar increase, cities 26.7 percent, and water districts 19.2 percent. School districts went from $74.9 billion to $148.4 billion. Cities went from $69.4 billion to $111.3 billion. Water districts went from $25.0 billion to $55.0 billion.
By pledge in FY2025: tax-supported general obligation $256.4 billion, revenue $108.9 billion, lease-purchase $0.1 billion.
The largest FY2025 balance is Houston at $15.4 billion. Only $3.5 billion of that is tax-supported. $11.8 billion is revenue-backed, mostly utility, airport, and similar debt, not property-tax debt. Then San Antonio $14.4 billion, the North Texas Tollway Authority $8.5 billion, DFW Airport $7.7 billion, and Austin $7.7 billion.
The Board’s own per-Texan figures, from page 4 of the annual report, go from $7,631 in FY2016 to $11,789 in FY2025, while population grew 13.9 percent. Issuance fees reported for FY2025 were $952.1 million on $61.9 billion par sold, up from $744.2 million in FY2024.
This is debt owed, not money borrowed that year
Each figure is the sum of issuance-level rows in the Bond Review Board’s file of debt outstanding. One row is one issuance in one fiscal year. The field is principal still owed at each August 31 year-end. It excludes conduit debt and obligations under one year. “Nine years” is FY2016 to FY2025. The Board describes the same span as the past 10 years.
The open-data sum is not the Board’s published total. The 2025 Local Government Annual Report, Table 1.1, puts FY2025 at $368.9 billion, about $3.4 billion, or 0.9 percent, above the open-data sum of $365.5 billion. The plate shows that cross-check. The gap is mostly cities, then water districts, counties, and other special districts. School districts match. The report notes that FY2025 amounts do not include cash defeasance data, and its executive summary says $368.30 billion while Table 1.1 says $368.89 billion. The report’s 10-year growth is 76 percent. The headline holds either way. Cite $368.9 billion when a single official total is required. Cite $365.5 billion as the sum of the open-data rows.
Caveats
Dollars are nominal unless marked. The real-terms figure uses national CPI-U, August to August, not a Texas deflator. The Board’s headline fee average of $15.75 per $1,000 excludes conduit, private placement, and short-term notes, so it differs from the $15.37 calculated from the fee file. A handful of rows show zero or negative principal, and five duplicate issuance-year keys exist. They are included as published and are immaterial.
Sources
- Debt outstanding by issuance, local, by year, data.texas.gov/d/3qmf-seku. Posted August 26, 2026.
- Local issuance fees by year, data.texas.gov/d/9gzb-2s7j. Updated October 6, 2026.
- 2025 Local Government Annual Report, February 2026, Table 1.1, Table 1.3, and page 4.
- BRB Data Center, which shows the open-data FY2025 total.
- CPI-U, U.S. Bureau of Labor Statistics, not seasonally adjusted: August 2016 and August 2025. Retrieved October 8, 2026.