Related story
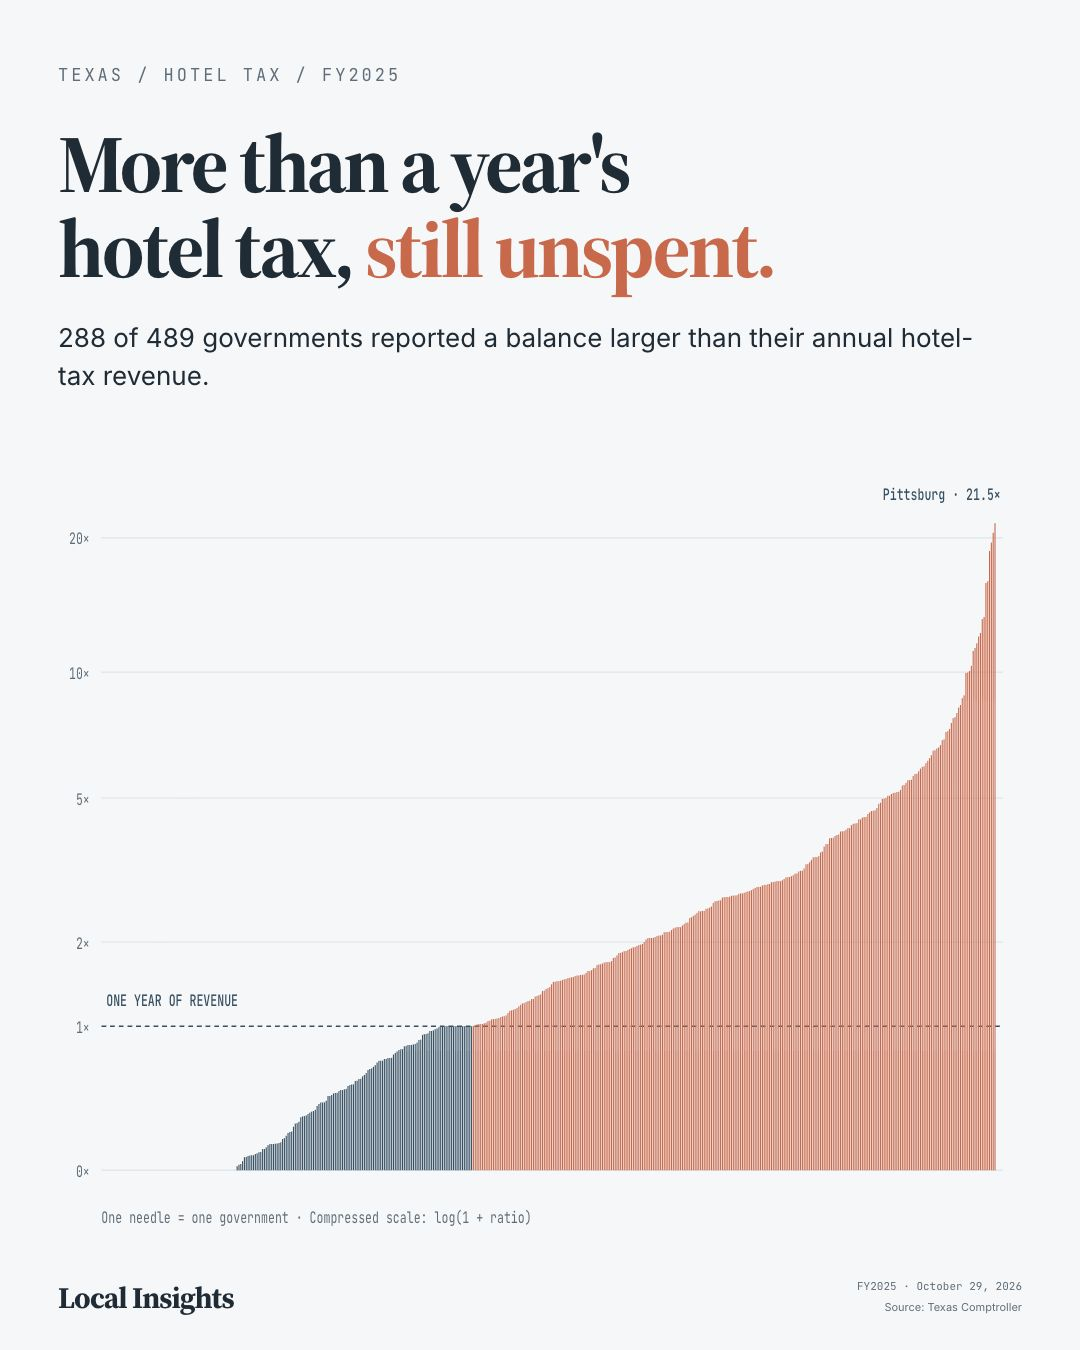
More than a year's hotel tax, still unspentSan Antonio stands out at 8.6% institutional — nearly 3× the Texas average. Fort Worth has the highest small-investor concentration at 23.7%. Austin at 0.5% institutional is an outlier in the other direction.
This entry provides context and source notes. Its detailed explanation remains in the original build; a separate visual breakdown has not yet been authored here.
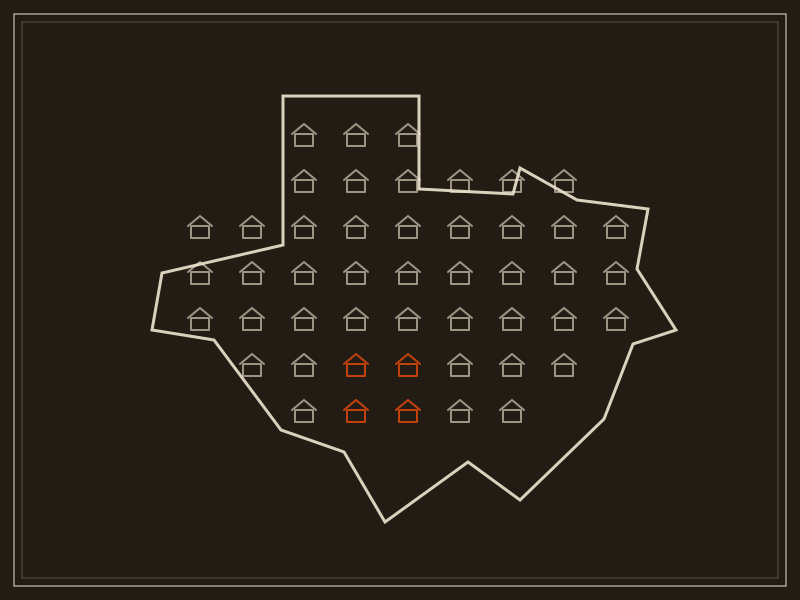
A five-city ISOTYPE unit chart of 3.1 million SFR parcels across Harris, Dallas, Tarrant, Bexar, and Travis counties. San Antonio's institutional ownership rate is nearly triple the state average. Austin is barely touched.
Compare corporate and small-investor landlord concentration across Texas's five largest metros using certified appraisal district data.
San Antonio stands out at 8.6% institutional — nearly 3× the Texas average. Fort Worth has the highest small-investor concentration at 23.7%. Austin at 0.5% institutional is an outlier in the other direction.
Open the full visualizationEntity name normalization, LLC detection, national SFR operator fuzzy matching, and cluster-by-shared-mailing-address across 3.16M SFR parcels (state class A1/A2) in five counties. Institutional threshold: 25+ homes per cluster. Cross-county deduplication applied.
Related story
More than a year's hotel tax, still unspent