Related story
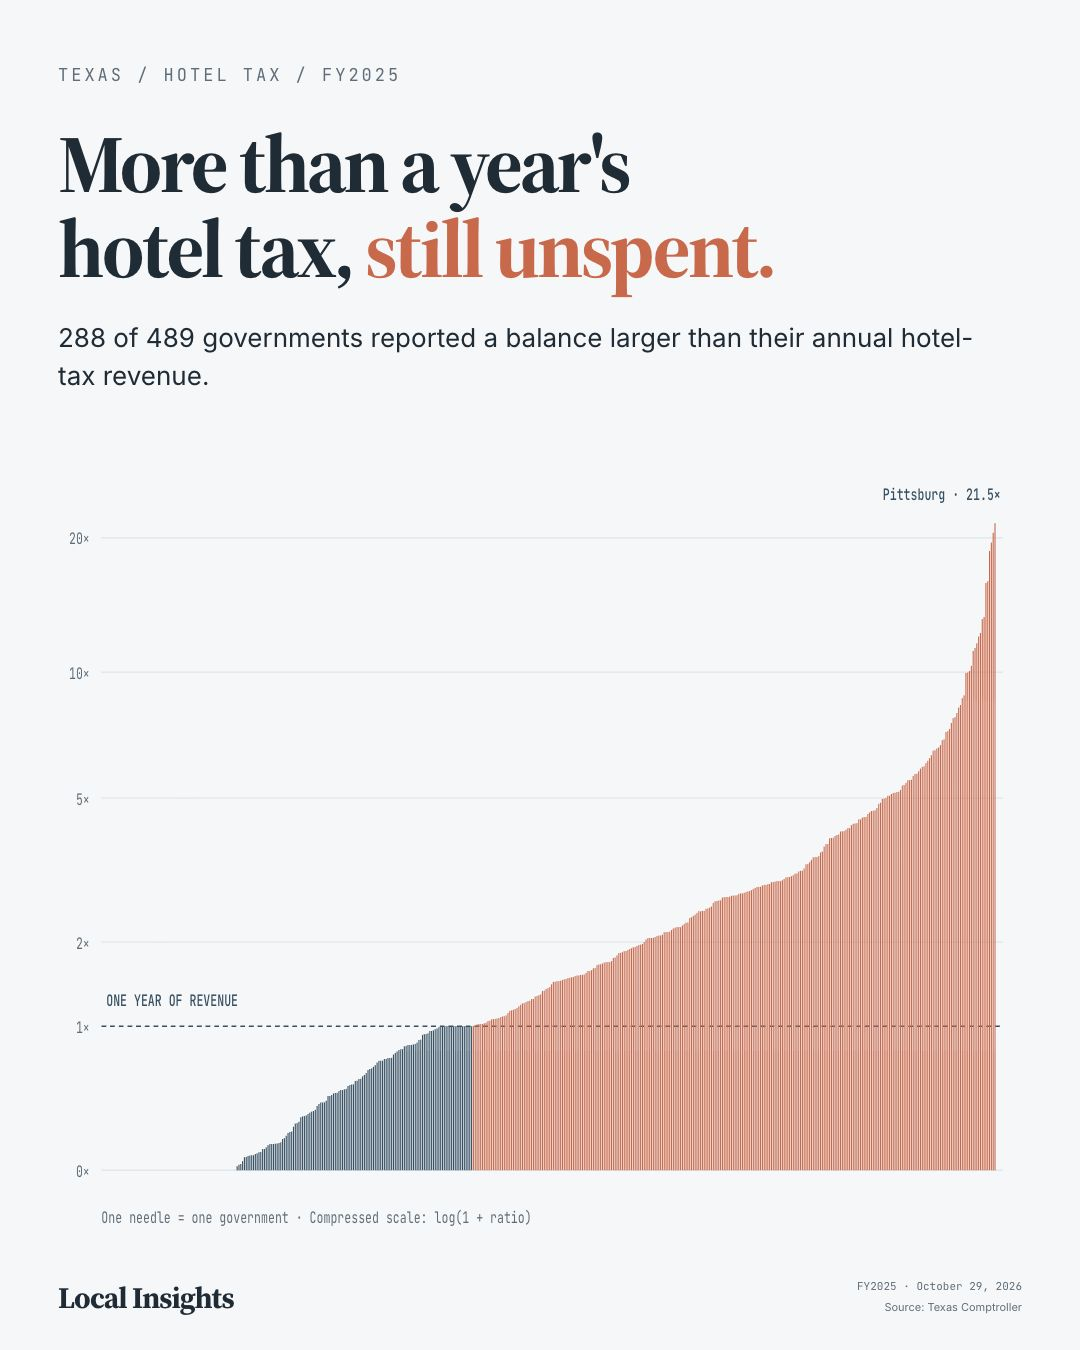
More than a year's hotel tax, still unspentPension data is typically buried in hundreds of pages of actuarial reports. This grid makes it possible to compare all 99 plans side-by-side in seconds, identifying which are recovering and which are deteriorating.
This entry provides context and source notes. Its detailed explanation remains in the original build; a separate visual breakdown has not yet been authored here.
A small multiples grid showing funding ratio trends for all 99 Texas public pension plans from FY2013-2024. Sortable, filterable, and color-coded by funding health.
This companion view to the pension investigation provides an at-a-glance comparison of every Texas pension plan's trajectory over the past decade. Each sparkline tells a story — improving, declining, or stagnant.
Pension data is typically buried in hundreds of pages of actuarial reports. This grid makes it possible to compare all 99 plans side-by-side in seconds, identifying which are recovering and which are deteriorating.
Open the full visualizationSmall multiples visualization of funding ratios across all 99 Texas Pension Review Board-overseen plans. Data spans FY2013-2024 actuarial valuations. Color coding based on funded ratio thresholds: green (80%+), yellow (60-80%), red (below 60%).
Related story
More than a year's hotel tax, still unspent