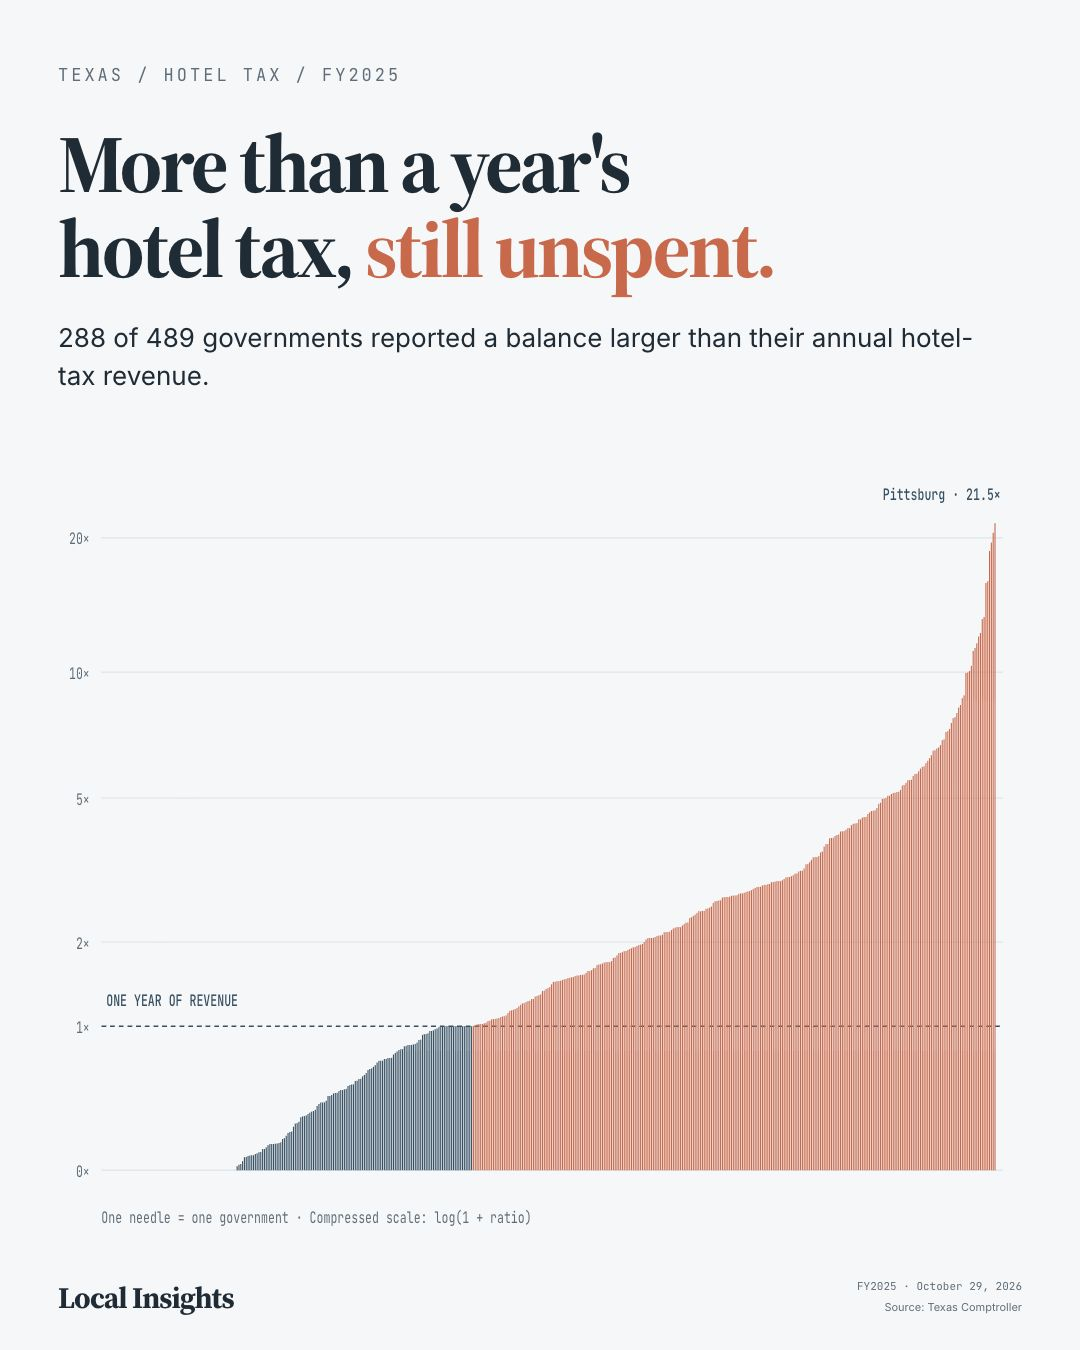
Related story
More than a year's hotel tax, still unspentMixed-beverage receipts are a proxy for main-street vitality — bars, restaurants, and live-music rooms. A single-venue county sitting at zero for years running is a small town losing its last gathering place, invisible inside a record statewide total.
This entry provides context and source notes. Its detailed explanation remains in the original build; a separate visual breakdown has not yet been authored here.
A scrollytelling investigation of nineteen years of Texas mixed-beverage receipts. Statewide, drinking is booming — revenue doubled and shrugged off a 39% pandemic crater. Yet five metro counties take 63% of every dollar, and out in the long tail a handful of rural counties run on a single venue: when it closes, the county goes to zero. Includes a per-county lookup for all 234 counties with mixed-beverage activity.
Built from the Texas Comptroller Mixed Beverage Gross Receipts dataset (3.78M establishment-month records, Jan 2007–Jun 2026) to trace the geography of Texas nightlife — the boom, the metro concentration, and the rural counties that have gone quiet.
Mixed-beverage receipts are a proxy for main-street vitality — bars, restaurants, and live-music rooms. A single-venue county sitting at zero for years running is a small town losing its last gathering place, invisible inside a record statewide total.
Open the full visualizationAggregated 3.78M establishment-month records by obligation end date; 2026 is partial (through June) and excluded from year-over-year claims. Inflation adjustment uses CPI-U. County identities mapped from Comptroller county codes (254-county crosswalk). "Went quiet" = counties whose peak year exceeded $50K, now below 15% of that peak, that ever had 3 or fewer reporting outlets. Aggregate, PII-safe.
Related story
More than a year's hotel tax, still unspent