Related story
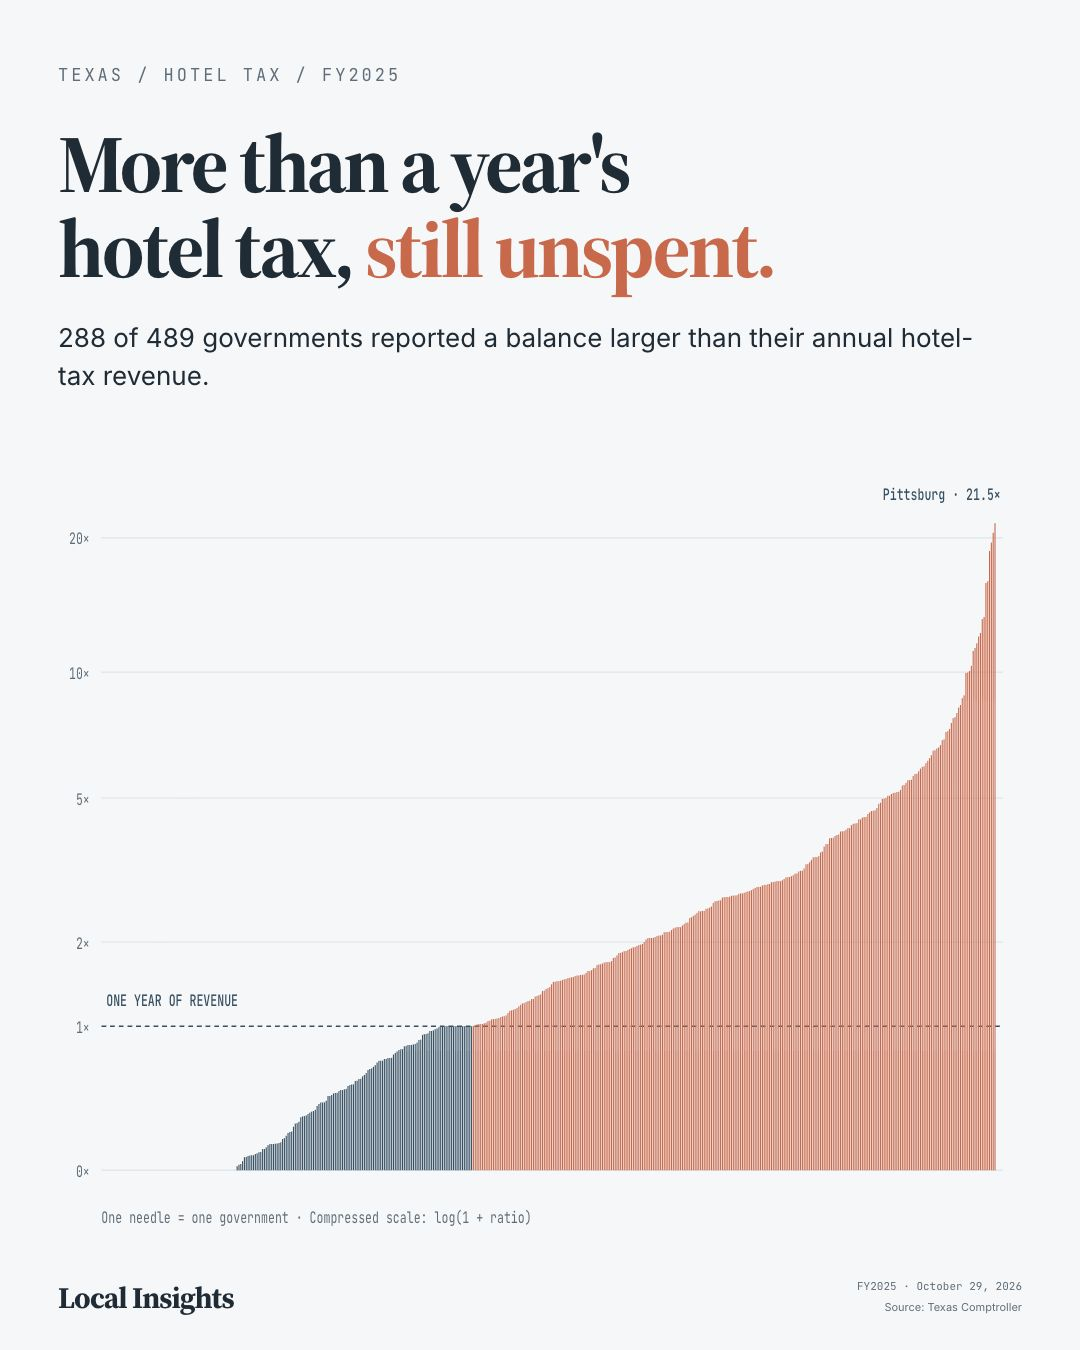
More than a year's hotel tax, still unspentWhen FEMA redraws a flood zone boundary, it changes what homeowners pay for insurance, what their property is worth, and whether they can get a mortgage. These decisions happen quietly and affect millions — but most residents only find out when the bill arrives.
This entry provides context and source notes. Its detailed explanation remains in the original build; a separate visual breakdown has not yet been authored here.
An editorial investigation of FEMA flood zone reclassifications across the Houston metro area — which neighborhoods saw risk increase, which saw decreases, and what it means for insurance premiums and property values.
This investigation maps the geography of FEMA flood zone reclassifications across Houston metro counties (Harris, Fort Bend, Montgomery), revealing how federal risk redrawing reshapes insurance costs, property values, and neighborhood vulnerability. Built from FEMA CSLF and NFHL data with real-time address lookup.
When FEMA redraws a flood zone boundary, it changes what homeowners pay for insurance, what their property is worth, and whether they can get a mortgage. These decisions happen quietly and affect millions — but most residents only find out when the bill arrives.
Open the full visualizationReal-time FEMA CSLF API queries for SFHA change polygons across Houston metro counties. Address lookup queries both effective and pending NFHL layers. Insurance estimates from FEMA Risk Rating 2.0 ZIP-level medians. 46,676 total zone change records, 653 mapped GeoJSON features.
Related story
More than a year's hotel tax, still unspent